This is a start of several posts going from K-means to Variational Mixuture of Gaussians.
Let’s start off with the easiest scenario - K-means. The algorithm looks like this:
- Generate centroids at random
- Assign each point the nearest centroid
- Re-estimate the new centroids by taking the mean of the points which have been assigned.
- Go back to 2 until convergence
Let’s go and implement this!
import random
import math
import numpy as np
from plotnine import ggplot, geom_point, aes
import pandas as pd
class Kmeans:
def __init__(self, n_components=3, iters=100):
self.n_components = n_components
self.iters = iters
self.centroids = []
def _generate_centroids(self, X):
# assume that the data input is 2d
min_x0 = min([x[0] for x in X])
max_x0 = max([x[0] for x in X])
min_x1 = min([x[1] for x in X])
max_x1 = max([x[1] for x in X])
x0_sample = [(((x/100) * max_x0) + min_x0) for x in range(101)]
x1_sample = [(((x/100) * max_x1) + min_x1) for x in range(101)]
for _ in range(self.n_components):
self.centroids.append((random.choice(x0_sample), random.choice(x1_sample)))
def dist(self, x, y):
return math.sqrt((x[0]-y[0])*(x[0]-y[0]) + (x[1]-y[1])*(x[1]-y[1]))
def _assign_step(self, X):
assign_comp = []
for x in X:
all_dist = [(idx, self.dist(x, y)) for idx, y in enumerate(self.centroids)]
min_dist = min([el[1] for el in all_dist])
cent = [el[0] for el in all_dist if el[1] == min_dist][0]
assign_comp.append(cent)
return assign_comp
def _update_centroid(self, X, assign):
for idx in range(self.n_components):
X_part = [x for x, y in zip(X, assign) if y == idx]
n = len(X_part)
x_mean = sum([x[0] for x in X_part])/n
y_mean = sum([x[1] for x in X_part])/n
self.centroids[idx] = (x_mean, y_mean)
def fit(self, X):
self._generate_centroids(X)
for _ in range(self.iters):
X_assign = self._assign_step(X)
self._update_centroid(X, X_assign)
return self
def predict(self, X):
return self._assign_step(X)
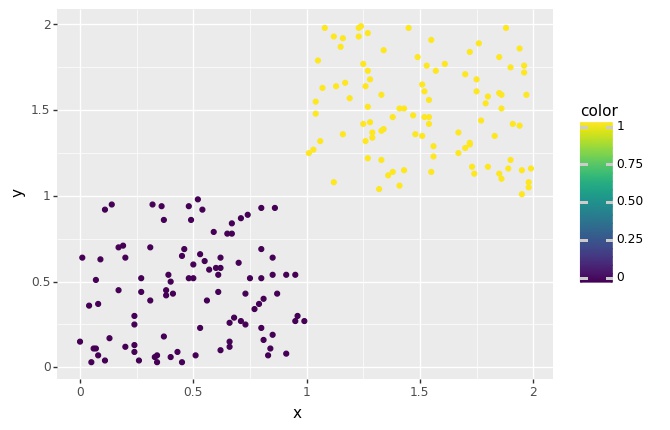
km = Kmeans(2, 10)
clust1 = [(random.choice([x/100 for x in range(100)]), random.choice([x/100 for x in range(100)])) for _ in range(100)]
clust2 = [(random.choice([x/100 + 1 for x in range(100)]), random.choice([x/100 + 1 for x in range(100)])) for _ in range(100)]
X = clust1 + clust2
km.fit(X)
y = km.predict(X)
df = pd.DataFrame({
'x': [x[0] for x in X],
'y': [x[1] for x in X],
'color': y
})
p = (ggplot(df, aes('x', 'y', color='color')) + geom_point())
Let’s now extent this so that we can do some color quantization in a 3D tensor!
import random
import math
from sklearn.datasets import load_sample_image
from sklearn.utils import shuffle

import matplotlib.pyplot as plt

china = load_sample_image("china.jpg")
china = np.array(china, dtype=np.float64) / 255
w, h, d = original_shape = tuple(china.shape)
image_array = np.reshape(china, (w * h, d)) # a list of pixel colours
image_array_sample = shuffle(image_array, random_state=0)[:1000]
n_colors = 32

class KmeansColor(Kmeans):
    def _generate_centroids(self, X):
        # we've rescaled our output!
        for _ in range(self.n_components):
            self.centroids.append((random.random(), random.random(), random.random()))

    def _update_centroid(self, X, assign):
        for idx in range(self.n_components):
            X_part = [x for x, y in zip(X, assign) if y == idx]
            n = max(len(X_part), 1)

            cent = tuple([sum([x[ch] for x in X_part])/n for ch in range(3)])
            self.centroids[idx] = cent

    def get_centroid(self):
        return [(int(x[0]*255), int(x[1]*255), int(x[2]*255)) for x in self.centroids]

km = KmeansColor(n_colors, 20)
km.fit(image_array_sample)
image_array_colors = km.predict(image_array)

# now assign based on centroid colors
pred_cols = km.get_centroid()
recreate_china = np.array([pred_cols[x] for x in image_array_colors]).reshape(w, h, d)
plt.imshow(recreate_china)
This yields the input 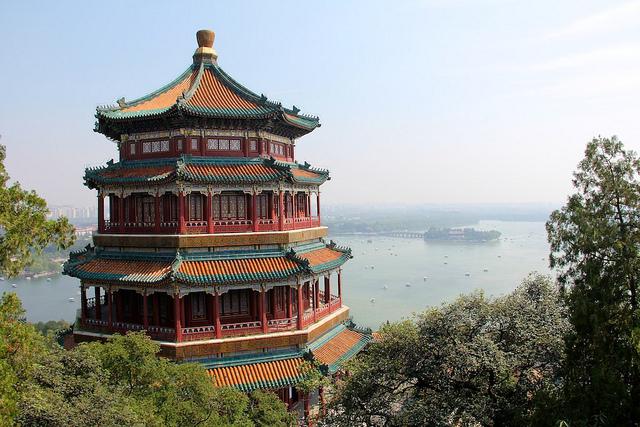 and output